
主成分分析(PCA)简介
目标
在本教程中,您将学习如何:
- 使用OpenCV类cv :: PCA来计算对象的方向。
什么是PCA?
主成分分析(PCA)是提取数据集最重要特征的统计程序。
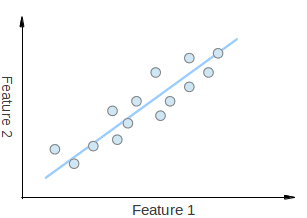
考虑到您有一组2D点,如上图所示。每个维度对应于您感兴趣的功能。这里有些人可能会认为这些点是按随机顺序设置的。但是,如果你有一个更好的外观,你会看到有一个线性模式(由蓝线表示),很难解雇。PCA的关键点是减少维度。缩小维数是减少给定数据集维数的过程。例如,在上述情况下,可以将点的集合近似为单行,因此,将给定点的维数从2D减小到1D。
此外,您还可以看到,这些点在蓝线上最多变化,而不是沿着“特征1”或“特征2”轴变化。这意味着如果您知道点沿蓝色线的位置,您将获得有关该点的更多信息,而不仅仅知道它在特征1轴或特征2轴上的位置。
因此,PCA允许我们找到我们的数据变化最大的方向。事实上,在图中的点集上运行PCA的结果由称为特征向量的2个向量组成,它们是数据集的主要组成部分。
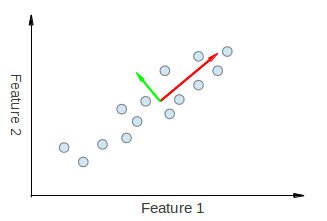
每个特征向量的大小被编码在相应的特征值中,并且指示数据沿主要分量变化多少。特征向量的开始是数据集中所有点的中心。将PCA应用于N维数据集产生N N维特征向量,N个特征值和1个N维中心点。足够的理论,让我们看看我们如何把这些想法变成代码。
计算特征向量和特征值?
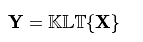
我们的目标是将给定的维度p的数据集x转换为较小维度L的可选数据集y。。同样,我们正在寻找矩阵Y,其中Y是矩阵X的Karhunen-Loève transform(KLT):
组织数据集
假设您拥有包含一组p变量观测数据的数据,并且您希望减少数据,以便只能使用变量L,L < p。描述每个观察值。进一步假设数据被排列为n个数据向量的集合 x1...xn ,其中每个xi表示变量p的单个分组观察值。
写x1…xn为行向量,其中每个P列。
把行向量为一个矩阵X的尺寸N×P.
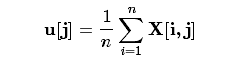
计算经验平均值
求出每个维度j的平均经验值j=1,,p....
将计算出平均值为实证均值向量U,大小为 p×1.
计算与平均值的偏差
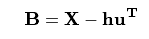
平均减法是找到最小化近似数据的均方误差的主成分基础的解决方案的组成部分。因此,我们以数据为中心进行如下:
- 从数据矩阵X的每一行减去经验均值向量u。
Store平均减去数据在N×P矩阵B
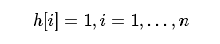
其中h是一个N×1列向量在所有的 1s中:
找到协方差矩阵
- 从矩阵B的外积与自身找出经验协方差矩阵C:p × p
发现P×P经验协方差矩阵C从矩阵B外产品本身:
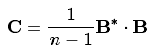
其中*是共轭转置运算符。注意,如果B完全由实数组成,在许多应用中是这种情况,则“共轭转置”与常规转置相同。
找到协方差矩阵的特征向量和特征值
- 计算协方差矩阵C对角化的特征向量的矩阵V:
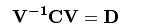
其中D是C的特征值的对角矩阵。
- 矩阵D将采用对角矩阵的形式:p×p
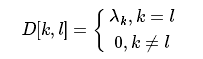
在这里,λJ是协方差矩阵C的第j个特征值
- 矩阵V也是维数p x p,包含p列向量,每个长度p表示协方差矩阵C的p个特征向量。
- 特征值和特征向量是有序和配对的。第j个特征值对应于第j个特征向量。
源代码
本教程代码如下所示。您也可以从这里下载。
#include <iostream>
#include <opencv2/opencv.hpp>
using namespace std;
using namespace cv;
// Function declarations
void drawAxis(Mat&, Point, Point, Scalar, const float);
double getOrientation(const vector<Point> &, Mat&);
void drawAxis(Mat& img, Point p, Point q, Scalar colour, const float scale = 0.2)
{
    double angle;
    double hypotenuse;
    angle = atan2( (double) p.y - q.y, (double) p.x - q.x ); // angle in radians
    hypotenuse = sqrt( (double) (p.y - q.y) * (p.y - q.y) + (p.x - q.x) * (p.x - q.x));
//    double degrees = angle * 180 / CV_PI; // convert radians to degrees (0-180 range)
//    cout << "Degrees: " << abs(degrees - 180) << endl; // angle in 0-360 degrees range
    // Here we lengthen the arrow by a factor of scale
    q.x = (int) (p.x - scale * hypotenuse * cos(angle));
    q.y = (int) (p.y - scale * hypotenuse * sin(angle));
    line(img, p, q, colour, 1, CV_AA);
    // create the arrow hooks
    p.x = (int) (q.x + 9 * cos(angle + CV_PI / 4));
    p.y = (int) (q.y + 9 * sin(angle + CV_PI / 4));
    line(img, p, q, colour, 1, CV_AA);
    p.x = (int) (q.x + 9 * cos(angle - CV_PI / 4));
    p.y = (int) (q.y + 9 * sin(angle - CV_PI / 4));
    line(img, p, q, colour, 1, CV_AA);
}
double getOrientation(const vector<Point> &pts, Mat &img)
{
    //Construct a buffer used by the pca analysis
    int sz = static_cast<int>(pts.size());
    Mat data_pts = Mat(sz, 2, CV_64FC1);
    for (int i = 0; i < data_pts.rows; ++i)
    {
        data_pts.at<double>(i, 0) = pts[i].x;
        data_pts.at<double>(i, 1) = pts[i].y;
    }
    //Perform PCA analysis
    PCA pca_analysis(data_pts, Mat(), CV_PCA_DATA_AS_ROW);
    //Store the center of the object
    Point cntr = Point(static_cast<int>(pca_analysis.mean.at<double>(0, 0)),
                      static_cast<int>(pca_analysis.mean.at<double>(0, 1)));
    //Store the eigenvalues and eigenvectors
    vector<Point2d> eigen_vecs(2);
    vector<double> eigen_val(2);
    for (int i = 0; i < 2; ++i)
    {
        eigen_vecs[i] = Point2d(pca_analysis.eigenvectors.at<double>(i, 0),
                                pca_analysis.eigenvectors.at<double>(i, 1));
        eigen_val[i] = pca_analysis.eigenvalues.at<double>(i);
    }
    // Draw the principal components
    circle(img, cntr, 3, Scalar(255, 0, 255), 2);
    Point p1 = cntr + 0.02 * Point(static_cast<int>(eigen_vecs[0].x * eigen_val[0]), static_cast<int>(eigen_vecs[0].y * eigen_val[0]));
    Point p2 = cntr - 0.02 * Point(static_cast<int>(eigen_vecs[1].x * eigen_val[1]), static_cast<int>(eigen_vecs[1].y * eigen_val[1]));
    drawAxis(img, cntr, p1, Scalar(0, 255, 0), 1);
    drawAxis(img, cntr, p2, Scalar(255, 255, 0), 5);
    double angle = atan2(eigen_vecs[0].y, eigen_vecs[0].x); // orientation in radians
    return angle;
}
int main(int argc, char** argv)
{
    // Load image
    String imageName("../data/pca_test1.jpg"); // by default
    if (argc > 1)
    {
        imageName = argv[1];
    }
    Mat src = imread( imageName );
    // Check if image is loaded successfully
    if(!src.data || src.empty())
    {
        cout << "Problem loading image!!!" << endl;
        return EXIT_FAILURE;
    }
    imshow("src", src);
    // Convert image to grayscale
    Mat gray;
    cvtColor(src, gray, COLOR_BGR2GRAY);
    // Convert image to binary
    Mat bw;
    threshold(gray, bw, 50, 255, CV_THRESH_BINARY | CV_THRESH_OTSU);
    // Find all the contours in the thresholded image
    vector<Vec4i> hierarchy;
    vector<vector<Point> > contours;
    findContours(bw, contours, hierarchy, CV_RETR_LIST, CV_CHAIN_APPROX_NONE);
    for (size_t i = 0; i < contours.size(); ++i)
    {
        // Calculate the area of each contour
        double area = contourArea(contours[i]);
        // Ignore contours that are too small or too large
        if (area < 1e2 || 1e5 < area) continue;
        // Draw each contour only for visualisation purposes
        drawContours(src, contours, static_cast<int>(i), Scalar(0, 0, 255), 2, 8, hierarchy, 0);
        // Find the orientation of each shape
        getOrientation(contours[i], src);
    }
    imshow("output", src);
    waitKey(0);
    return 0;
}另一个例子使用PCA降维的同时保持方差量可以在opencv_source_code / samples / cpp / pca.cpp发现
说明
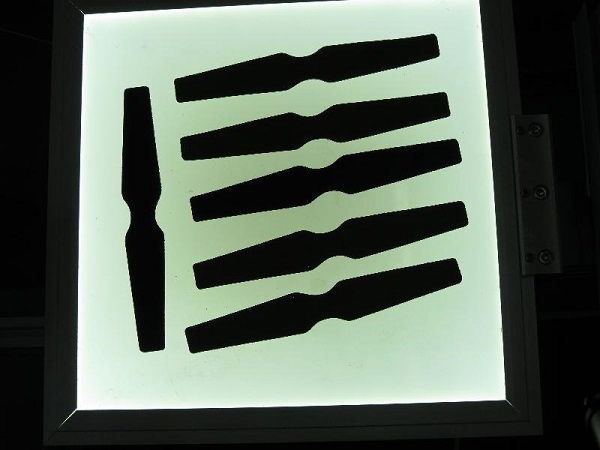
- 读取图像并将其转换为二进制这里我们应用必要的预处理程序,以便能够检测到感兴趣的对象。
    // Load image
    String imageName("../data/pca_test1.jpg"); // by default
    if (argc > 1)
    {
        imageName = argv[1];
    }
    Mat src = imread( imageName );
    // Check if image is loaded successfully
    if(!src.data || src.empty())
    {
        cout << "Problem loading image!!!" << endl;
        return EXIT_FAILURE;
    }
    imshow("src", src);
    // Convert image to grayscale
    Mat gray;
    cvtColor(src, gray, COLOR_BGR2GRAY);
    // Convert image to binary
    Mat bw;
threshold(gray, bw, 50, 255, CV_THRESH_BINARY | CV_THRESH_OTSU);- 提取感兴趣的对象
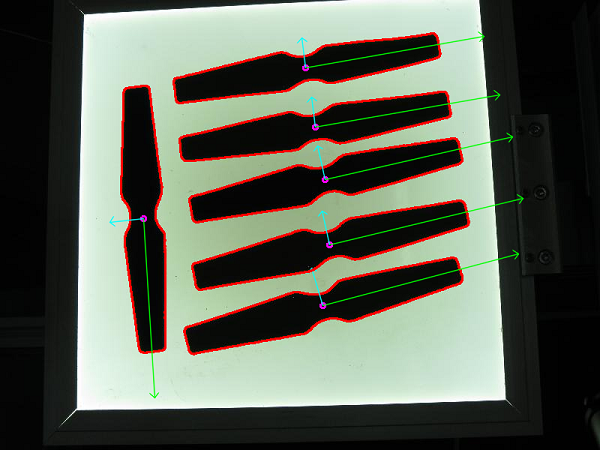
然后通过大小查找和过滤轮廓,并获得剩余轮廓的方向。
    // Find all the contours in the thresholded image
    vector<Vec4i> hierarchy;
    vector<vector<Point> > contours;
    findContours(bw, contours, hierarchy, CV_RETR_LIST, CV_CHAIN_APPROX_NONE);
    for (size_t i = 0; i < contours.size(); ++i)
    {
        // Calculate the area of each contour
        double area = contourArea(contours[i]);
        // Ignore contours that are too small or too large
        if (area < 1e2 || 1e5 < area) continue;
        // Draw each contour only for visualisation purposes
        drawContours(src, contours, static_cast<int>(i), Scalar(0, 0, 255), 2, 8, hierarchy, 0);
        // Find the orientation of each shape
        getOrientation(contours[i], src);
}- 提取方向
通过调用getOrientation()函数提取方向,该函数执行所有PCA过程。
    //Construct a buffer used by the pca analysis
    int sz = static_cast<int>(pts.size());
    Mat data_pts = Mat(sz, 2, CV_64FC1);
    for (int i = 0; i < data_pts.rows; ++i)
    {
        data_pts.at<double>(i, 0) = pts[i].x;
        data_pts.at<double>(i, 1) = pts[i].y;
    }
    //Perform PCA analysis
    PCA pca_analysis(data_pts, Mat(), CV_PCA_DATA_AS_ROW);
    //Store the center of the object
    Point cntr = Point(static_cast<int>(pca_analysis.mean.at<double>(0, 0)),
                      static_cast<int>(pca_analysis.mean.at<double>(0, 1)));
    //Store the eigenvalues and eigenvectors
    vector<Point2d> eigen_vecs(2);
    vector<double> eigen_val(2);
    for (int i = 0; i < 2; ++i)
    {
        eigen_vecs[i] = Point2d(pca_analysis.eigenvectors.at<double>(i, 0),
                                pca_analysis.eigenvectors.at<double>(i, 1));
        eigen_val[i] = pca_analysis.eigenvalues.at<double>(i);
}首先,数据需要排列成大小为n×2的矩阵,其中n是我们拥有的数据点数。那么我们可以执行PCA分析。计算平均值(即质心)存储在cntr变量中,特征向量和特征值存储在相应的std :: vector中。
- 可视化结果
最终结果通过drawAxis()函数进行可视化,其中主要成分以行表示,每个特征向量乘以其特征值并转换为平均位置。
    // Draw the principal components
    circle(img, cntr, 3, Scalar(255, 0, 255), 2);
    Point p1 = cntr + 0.02 * Point(static_cast<int>(eigen_vecs[0].x * eigen_val[0]), static_cast<int>(eigen_vecs[0].y * eigen_val[0]));
    Point p2 = cntr - 0.02 * Point(static_cast<int>(eigen_vecs[1].x * eigen_val[1]), static_cast<int>(eigen_vecs[1].y * eigen_val[1]));
    drawAxis(img, cntr, p1, Scalar(0, 255, 0), 1);
    drawAxis(img, cntr, p2, Scalar(255, 255, 0), 5);
    double angle = atan2(eigen_vecs[0].y, eigen_vecs[0].x); // orientation in radians
double angle;
double hypotenuse;
angle = atan2( (double) p.y - q.y, (double) p.x - q.x ); // angle in radians
hypotenuse = sqrt( (double) (p.y - q.y) * (p.y - q.y) + (p.x - q.x) * (p.x - q.x));
// double degrees = angle * 180 / CV_PI; // convert radians to degrees (0-180 range)
// cout << "Degrees: " << abs(degrees - 180) << endl; // angle in 0-360 degrees range
// Here we lengthen the arrow by a factor of scale
q.x = (int) (p.x - scale * hypotenuse * cos(angle));
q.y = (int) (p.y - scale * hypotenuse * sin(angle));
line(img, p, q, colour, 1, CV_AA);
// create the arrow hooks
p.x = (int) (q.x + 9 * cos(angle + CV_PI / 4));
p.y = (int) (q.y + 9 * sin(angle + CV_PI / 4));
line(img, p, q, colour, 1, CV_AA);
p.x = (int) (q.x + 9 * cos(angle - CV_PI / 4));
p.y = (int) (q.y + 9 * sin(angle - CV_PI / 4));
line(img, p, q, colour, 1, CV_AA);结果
代码打开图像,找到感兴趣的被检测对象的方位,然后通过绘制所检测到的对象的轮廓,中心点和关于提取的取向的x轴,y轴来显示结果。